Data Analysis For Business Assignment Example
In-Depth Guide to Car Price Prediction: Exploratory Data Analysis, Machine Learning Models, and Visualization Techniques
- 92650+ Project Delivered
- 1500+ Experts 24x7 Online Help
- No AI Generated Content
Data Analysis For Business Assignment
1. Introduction
The project focuses on a real-world business scenario for performing data analysis. As per the requirement, “exploratory data analysis” has been performed as it is essential since it administers discovering patterns, relationships, and acuities in data. This is responsible for allowing businesses for deciding with enthusiasm, creating prevailing strategies, and acquire an edge over competitors. Subsequently, the significance of maintaining robust data research utilizing machine learning dexterities is boosting in the contemporary data-driven business domain. Operating with real-world datasets raw statistics can be gathered along with performing exploratory data computation using Excel and Python. Accordingly, classification and regression techniques have been used for data analysis, creating machine learning instances, and assessing their persuasiveness via this approach. As per the requirement of the project, the car price prediction dataset has been taken to achieve the data analysis.
Looking for affordable assignment help online in the UK? New Assignment Help provides cost-effective solutions without compromising on quality. Our expert writers are dedicated to delivering high-quality assignments tailored to your specific requirements. We offer free assignment samples to demonstrate our commitment to excellence. Choose New Assignment Help for reliable and affordable assignment assistance.
2. EDA using Excel
In order to perform the data analysis, in the first step, exploratory data analysis has been performed for comprehending data structure, and trends as well as spot irregularities. Excel has been utilized for dealing with the raw statistics to deliver insightful data that might aid with judgment-making and handle conceivable topics for better research work (Maulud and Abdulazeez, 2020).
.webp)
Figure 2.1: City vs Highway mpg
Here, in the first step, city vs Highway mpg has been performed in order to perform the task while it has been identified that, the mileage of the cars is more on the highway as compared to the highway.
.webp)
Figure 2.2: Brand vs Popularity
Furthermore, Brand vs Popularity data has been analyzed. This has been seen that the “Ford” is the most popular brand in terms of getting sold each year throughout the world.
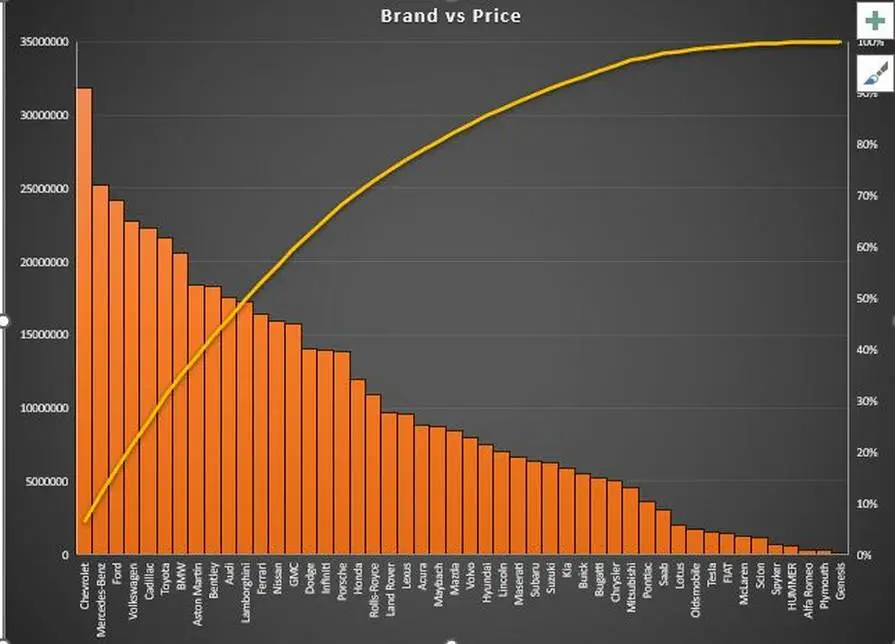
Figure 2.3: Brand vs Price
Apart from that, as compared to the Brand value along with the price of the available brands, Chevrolet has the highest price while the second highest in the list is Mercedes Benz.
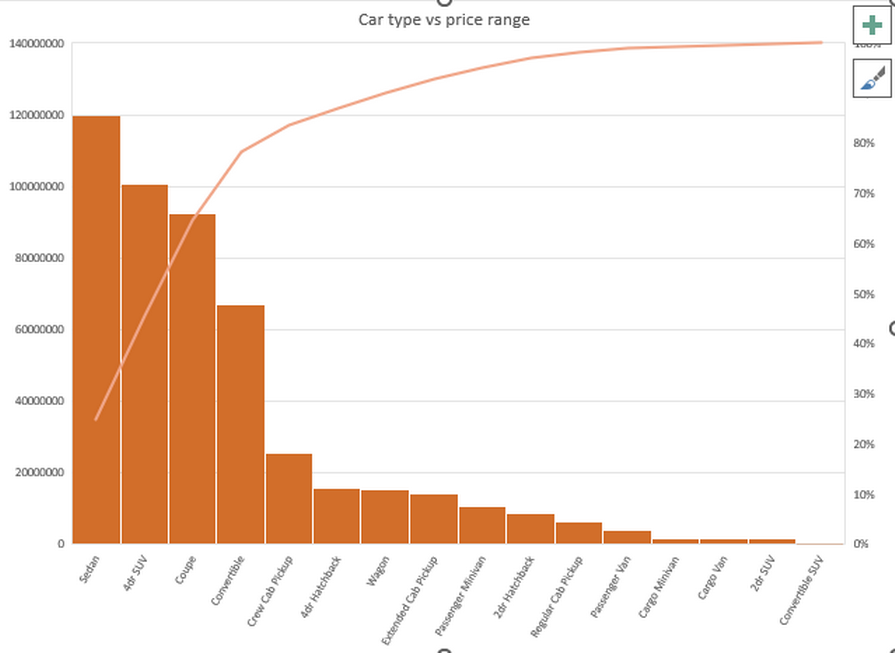
Figure 2.4: Car Type vs Price Range
Apart from that, the car price along with the price range has been analyzed depending on the need. Based on the car type, sedan cars are responsible for holding the 1st position \in terms of price.
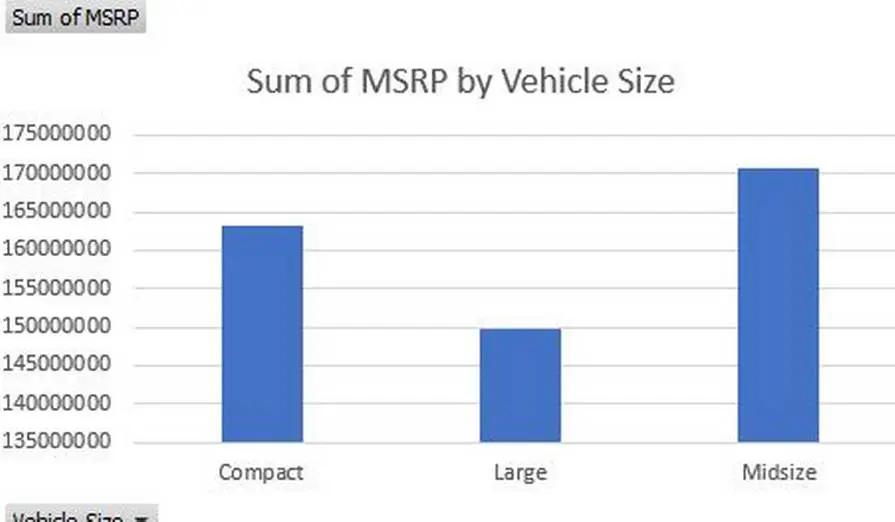
Figure 2.5: Car Size vs Price Range
Moreover, one more analysis has been done on the basis of the car size and the corresponding prices. As per the graph, it can be seen that the large cars are responsible for having the most amount of value while the sales are the lowest. In this section, compact cars have the lowest price but in terms of most selling medium size cars are at the top.
3. Introduction to Python programming for data analysis
The main work in research is based on car price prediction by using Python programming language. Besides this python, there are different languages which are effective in the data analysis process such as SQL, R programming language and so on. Different uses of language have pros and cons that directly reduce the effectiveness of the data analysis process. Here in this case python has mostly been used over all languages because of the construction of simple syntax and to make proper readability by the programmer. The major benefit of using this Python programming language is that it mainly cuts down on proper time data analytics that are directly familiar with the programming language. Using this Python mainly provides a task automation process and creates proper data visualization in an effective way. Big data analysis and explanation in an effective way to optimize proper rehabilitation that mainly creates a more effective model of care (Jones et al. 2020). Moreover, Python has provided an open-source library that mainly created a community-based model in the development process. Further, it can easily port multiple platforms and create proper data visualization, natural language processing and using different machine learning algorithms. Besides this using Python some of the R programming languages have mainly created proper drawbacks to the creation of a complicated language that mainly reduces to the creation of a steep learning curve. Further, it has been slower than other programming languages which mainly creates a proper lot of memory. In this process of using Python, it is effective to provide clear visualization and make a proper operationalization process in solving business problems and right-time data (Hidayat et al. 2020). This visualization has mainly provided no limit of data in presenting a proper data information process.
4. EDA using Python
Exploratory Data Analysis is responsible for apprehending the data sets with the help of summarization of their principal attributes, usually plotting them visually. This is significantly consequential specifically when modeling has been done for applying Machine learning. Devising in EDA is responsible for consisting of bar plot, dist plot and scatter plot and so on. It often takes time to investigate the information. However, the process associated with EDA, it can be asked to characterize the problem proclamation or connotation on the data cluster which is immensely substantial.
Figure 4.1: Cardata dataset
As per the requirement of the project, the car data dataset has been imported in the jupyter notebook platform. In the dataset, there are several columns such as Make, Model, Year, Engine fuel type, Engine cylinder, transmission type, driven wheels, number of doors, vehicle size, vehicle type, highway mpg and city mpg, popularity and MSRP. Here, MSRP columns are responsible for getting utilized as the target column (Gegic et al. 2019).
Figure 4.2: Checking the presence of null value
In the next step, the null value has been checked as per the need. This has been seen that the null values are present in the column name market category, engine cylinder and engine hp.
Figure 4.3: Checking the presence of null value
In this step, the null values have been removed with the use of .ffill() command.
Figure 4.4: Checking data types
Furthermore, the type of the data has been checked. Where, integer, floating and object types data are available in the field.
Figure 4.5: Checking the data description
As per the need of the analysis, the data description has been checked and it is capable of showcasing the min, max, mean, std, and count values. The mean value is very much essential in terms of the fact that, the MSRP value is the target column and that gets further transferred into the categorical value depending on the mean value (Peng et al. 2021).
Figure 4.6: Checking the data description
Furthermore, the duplicate values have been checked and further removed for the dataset in order to get a better accuracy score during the model implementation.
Figure 4.7: MSRP value
The above figure has mainly described the find out value of MSRP that was mainly created by “manufacturer's suggested retail price.” It has mainly taken readings from manufacturer to dealer at a suggested retail price. Here in this process to plot this MSRP value in Y axis it has used MSRP.
Figure 4.8: Correlation absolute value for each column
This figure has mainly described the creation of correlation in the creation of absolute value by selection of each column. Doing this correlation process is effective because the value consists of between -1 to +1. Creation of the stronger correlation make the coefficient denoted as a +1. In the case of showing coefficient as a positive number, it directly provides a variable that goes up. Here in this process correlation has consisted +1 that provides positive impact in car price prediction process.
Figure 4.9: Histogram plotting for column data
This figure has clearly described the plotting of the histogram of a car dataset in an effective way. This mainly provides proper visualization of “frequency distribution” by charting of historical data. Creation of this different histogram is effective proper visualization in comparing data.
Figure 4.10: Popularity irrespective of the brands
Identification of the proper popularity in the creation of irrespective brands has definitely helped in identification of the popularity of cars as per choice of consumers. Thus, in order to plot this popularity in the Y axis it has provided density and X axis has mentioned popularity.
Figure 4.11: Brands and their respective cost prediction
The above figure has mainly described the creation of proper brand representation by analysing the cost prediction process. In order to identify this car data process it is effectively used as a sort-by-value method that is directly helpful in sorting the cars as per ascending order of MSRP value.
Figure 4.12: Top ten car brands in terms of price
After doing a different analysis and regression process, the above figure basically shows the top 10 popular brand cars as per the price direction process. From this graph it is evident that the most popular car is Maybach as per price.
Figure 4.13: Correlation Matrix
The creation of a correlation matrix is effective to find out different variables that are mainly related to each other. This correlation coefficient has mainly consisted of two variables which directly change the effect of other variables. Here, it has mainly used cardata.corr() that provides proper correlation of different cars.
Figure 4.14: Heatmap
Generating a heatmap and plotting the figure is effective in the creation of visualization features and provide multiple pieces in different phases. Here in this heat map, each factor is described in a different colour.
Figure 4.15: Car count and Mean price value
The above graph has described the proper plot of car count with respect to the year. The generate of of this graph is effective to find out the mean MSRP value inn the price prediction process.
5. Model evaluation
5.1 Linear Regression
Figure 5.1: Regression Model
As per the requirement of the project, this is mentionable that the regression model has been implemented as per the requirement of the project. In that aspect, the Linear Regression model has been utilized in order to perform the task as per the requirement of the project scenario. Further, the model is responsible for the utilization of the correct method for the development of the accuracy score depending on the need (Sahoo et al. 2019).
Figure 5.2: Implementing Linear Regression Model
Furthermore, linear regression is responsible for dealing with the data analysis and further dealing with the data analysis. Here, the linear regression model has been preprocessed and further managed with the required R2 value.
Figure 5.2: R2 Score
This mainly generates the value of R2 score by importing data from linear regression. The creation of R square value is effective to provide the proper outcome of the dependent variable.
5.2 KNN
Figure 5.3: KNN classifier
The above figure has mainly provide find out value of KNN classifier that has taken test size 0.3 in a random state of 42.
5.3 Logistic Regression
Figure 5.4: Logistic Regression
The above figure has mainly provided the value of logistic regression from the import of sklearn. metrics.
6. Ethical Issues
The work has mainly utilized the proper public dataset from Kaggle that creates an effective car price prediction process. The ethical issues are mainly considered at the time of selection of the dataset from unauthorized sites that directly reduced the prediction process and authentication of this data. Using this dataset from Kaggle is effective to provide proper web scraping by handling in an ethical way. Besides this, use of the web scraping automated tool helps to make a proper collection of extraction of data and further analysis of given data. In the web-crawling process, it is directly involved in script and automatically retrieves data from the website. Thus in this overall process it must maintain ethics in the legibility of data in terms of infringement of copyright data and damage to websites (Venkatasubbu and Ganesh, 2019). Besides this, this damage may occur in the data analysis process and has been considered ethical. In order to resolve this situation it is effective to maintain proper privacy of data in an individual way. This research has to maintain proper knowledge of creating a consumer tool that is effective to provide validation of cars by using machine learning techniques that directly impacts the proper tool of consumers in selling cars more responsibly. Further It must have provided proper ethical concern in receiving a fair price and trust the scale of the overall process. In this process of effective selection of individual consumers, the car market and industry may have to consistently negatively impact the loss of jobs by the creation of ethical issues.
7. Conclusion
In a nutshell, this is mentionable that, in the business environment, EDA is necessary for achieving acquaintance as well as driving towards wise conclusions. Consequently, having sound data computation and machine learning capabilities is rudimentary depending on the developing use of information in the trade. Furthermore, this introspection deals with essential statistics, EDA, regression analysis, and classification analysis, as well as dealing with unsupervised learning operating corporate case deconstructions and real-world datasets using Excel and Python. In that aspect, the task has been done and four different models have been utilized in order to perform the task. The models utilized are KNN, Linear Regression, Logistic Regression and Kmeans. In that aspect, several graphs have been generated in order to perform the visualization while a correlation matrix also has been generated for checking the interrelation depending on the need. After model implementation, the F1 score and R2 score also have been getting generated.
8. References
Gegic, E., Isakovic, B., Keco, D., Masetic, Z. and Kevric, J., 2019. Car price prediction using machine learning techniques. TEM Journal, 8(1), p.113.
Hidayat, A., Jamaluddin, D. and Maylawati, D.S.A., 2020. Data analytics for effectiveness evaluation of islamic higher educationusing k-means algorithm. International Journal of Advanced Science and Technology, 29(3), pp.4149-4161.
Jones, M., Collier, G., Reinkensmeyer, D.J., DeRuyter, F., Dzivak, J., Zondervan, D. and Morris, J., 2020. Big data analytics and sensor-enhanced activity management to improve effectiveness and efficiency of outpatient medical rehabilitation. International journal of environmental research and public health, 17(3), p.748.
Maulud, D. and Abdulazeez, A.M., 2020. A review on linear regression comprehensive in machine learning. Journal of Applied Science and Technology Trends, 1(4), pp.140-147.
Peng, J., Wu, W., Lockhart, B., Bian, S., Yan, J.N., Xu, L., Chi, Z., Rzeszotarski, J.M. and Wang, J., 2021, June. Dataprep. eda: task-centric exploratory data analysis for statistical modeling in python. In Proceedings of the 2021 International Conference on Management of Data (pp. 2271-2280).
Sahoo, K., Samal, A.K., Pramanik, J. and Pani, S.K., 2019. Exploratory data analysis using Python. International Journal of Innovative Technology and Exploring Engineering (IJITEE), 8(12), p.2019.
Venkatasubbu, P. and Ganesh, M., 2019. Used Cars Price Prediction using Supervised Learning Techniques. Int. J. Eng. Adv. Technol.(IJEAT), 9(1S3).